
Reports
Laboratories of Capture: How the Tech Lobby Shapes State Data Privacy Laws
Included below is an executive summary of Laboratories of Capture: How the Tech Lobby Shapes State Data Privacy Laws. To read the full report, click the link below.

Reports
12 examples of how state legislators have drawn unfair maps for partisan gain over the next decade

Gerrymandering is the intentional practice of manipulating the boundaries of congressional districts to provide an unfair advantage for a specific party or group. The practice has increasingly created barriers to representative democracy and allows politicians to select their voters, rather than allowing voters to pick their politicians.
Gerrymandering is one reason that only about 10% to 15% of all 435 seats in the U.S. House of Representatives are generally considered competitive, one of the many reasons that gerrymandering is extremely unpopular with voters. According to a poll last year, 81% of Americans said they’d like to end partisan gerrymandering and stop the manipulation of congressional district lines that it brings. While historic, this practice is part of the larger assault on our elections and democratic norms that has been rocking our nation’s foundation over the last several years.
New maps that create the boundaries between congressional districts are drawn every 10 years, following each decennial census. In the wake of the 2020 Census, state legislators crafted a number of hyperpartisan and discriminatory gerrymanders. This new report from Issue One highlights a dozen of the worst.
The 12 extreme gerrymanders featured in this report are unbalanced and designed to favor one party, while disempowering voters. The nonpartisan Campaign Legal Center estimates that nine of these maps are more skewed than at least 80% of the enacted redistricting plans that it has analyzed over the past 50 years — and five are more skewed than 90% of other past maps.
In eight states — Illinois, Maryland, New York, North Carolina, Ohio, Oregon, Texas, and Wisconsin — state legislators passed new maps that were given “F” grades by the nonpartisan Princeton Gerrymandering Project, typically for giving a significant advantage to one party, reducing the competitiveness of districts, and splitting communities of interest into multiple districts.
Meanwhile, in three states — New Mexico, New York, and Utah — state legislators ignored the recommendations of their state’s independent redistricting commissions when developing their new skewed maps.
Legal challenges have already been made to several of these new maps.
For instance, state supreme courts in both North Carolina and Ohio each recently ruled that the new maps in those states were unconstitutional partisan gerrymanders, and a federal court recently ruled that Alabama’s new map violates the Voting Rights Act. The U.S. Department of Justice also says Texas’ new map violates the Voting Rights Act.
For more details on these 12 extreme gerrymanders, read on. And for more information about the redistricting process in all states, check out these resources and organizations that we found invaluable when writing this report: The Brennan Center for Justice, Campaign Legal Center’s PlanScore.org, the Princeton Gerrymandering Project, RepresentUs’s Gerrymandering Threat Index, Unite America, and FiveThirtyEight.com’s reporting on redistricting.
![]()
In 2020, then-President Donald Trump carried Alabama by 25.4 percentage points — winning 62% of the vote compared to Joe Biden’s 36.6%. Yet experts predict that Republicans will likely control 86% of the state’s seats in the U.S. House of Representatives under the new map passed in the state legislature by Alabama Republicans without any support from Alabama Democrats.
This new map, which a federal court recently ruled violated the Voting Rights Act, is expected to yield a 6-1 split between Republicans and Democrats, retaining the Republicans’ current 6-1 advantage. The nonpartisan Campaign Legal Center estimates that this map is more skewed than 89% of the enacted redistricting plans it has analyzed over the past 50 years.
While African Americans are 27% of the population in Alabama, the panel of three federal judges wrote the new Republican-drawn map gives Black voters “less opportunity than other Alabamians to elect candidates of their choice to Congress.” The court ordered state lawmakers to draw a new map with two congressional districts that would likely elect Black representatives, up from one — although earlier this month, the U.S. Supreme Court halted this decision and agreed to hear Alabama’s appeal of the federal court’s ruling, keeping the Republican-drawn map in place for the 2022 midterms.
![]()
In 2020, Joe Biden narrowly carried Georgia by 0.24 percentage points — winning 49.50% of the vote compared to then-President Donald Trump’s 49.26%. Yet experts predict that Republicans will likely control 64% of the state’s seats in the U.S. House of Representatives under the new map passed in the state legislature by Georgia Republicans without any support from Georgia Democrats. The new map is likely to yield a 9-5 split between Republicans and Democrats, up from Republicans’ current 8-6 advantage.
Many observers have also pointed out that nearly all of the demographic growth in Georgia over the past decade has come from communities of color, yet under the new map, the number of congressional districts represented by politicians of color is likely to shrink, not expand.
The nonpartisan Princeton Gerrymandering Project gave Georgia’s new map a “C” grade for partisan fairness because it facilitates a “Republican advantage.” And the nonpartisan Campaign Legal Center estimates that Georgia’s new map is more skewed than 89% of the enacted redistricting plans it has analyzed over the past 50 years.
![]()
In 2020, Joe Biden carried Illinois by 16.9 percentage points — winning 57.5% of the vote compared to then-President Donald Trump’s 40.6%. Yet experts predict that Democrats will likely control 82% of the state’s seats in the U.S. House of Representatives under the new map passed in the state legislature by Illinois Democrats without any support from Illinois Republicans.
While Illinois lost one seat after the 2020 Census reapportionment, the new map is likely to yield a 14-3 advantage for Democrats, up from their current 13-5 advantage. The map also reduces the number of “highly competitive seats” from 2 to 1.
The nonpartisan Princeton Gerrymandering Project gave Illinois’ new map an “F” grade for partisan fairness because it facilitates “significant advantages” to Democrats as well as to incumbents. The Princeton Gerrymandering Project also gave Illinois’ new map an “F” grade for geographic features and competitiveness, noting the map contains more county splits and “non-compact districts” than what is typical and is also “very uncompetitive relative to other maps that could have been drawn.”
For its part, the nonpartisan Campaign Legal Center estimates that Illinois’ new map is more skewed than 81% of the enacted redistricting plans it has analyzed over the past 50 years.
The new map places political pressure on several incumbent Republican representatives. For instance, Reps. Adam Kinzinger (R-IL) and Darin LaHood (R-IL) were placed together in the 16th Congressional District, which reportedly contributed to Kinzinger’s decision to not seek reelection in 2022.
![]()
In 2020, Joe Biden carried Maryland by 33.2 percentage points — winning 65.4% of the vote compared to then-President Donald Trump’s 32.2%. Yet experts predict that Democrats will likely control 87.5% of the state’s seats in the U.S. House of Representatives under the new map passed in the state legislature by Maryland Democrats without any support from Maryland Republicans. In December, Republican Gov. Larry Hogan vetoed the new map, but the Democratic-controlled state legislature quickly voted to override the governor’s veto.
Hogan had previously pushed for the implementation of an independent redistricting commission. A “fantasy league version” of this commission was established and produced its own proposal, but its maps were rejected by the legislature. A Hogan-linked anti-gerrymandering group has challenged the new map in court, arguing the map violates the state’s constitution.
The new map is likely to yield a 7-1 split between Democrats and Republicans, retaining the Democrats’ current 7-1 advantage. The nonpartisan Princeton Gerrymandering Project gave Maryland’s new map an “F” grade for partisan fairness because it facilitates a “significant Democratic advantage.” And the nonpartisan Campaign Legal Center estimates that Maryland’s new map is more skewed than 90% of the enacted redistricting plans it has analyzed over the past 50 years.
![]()
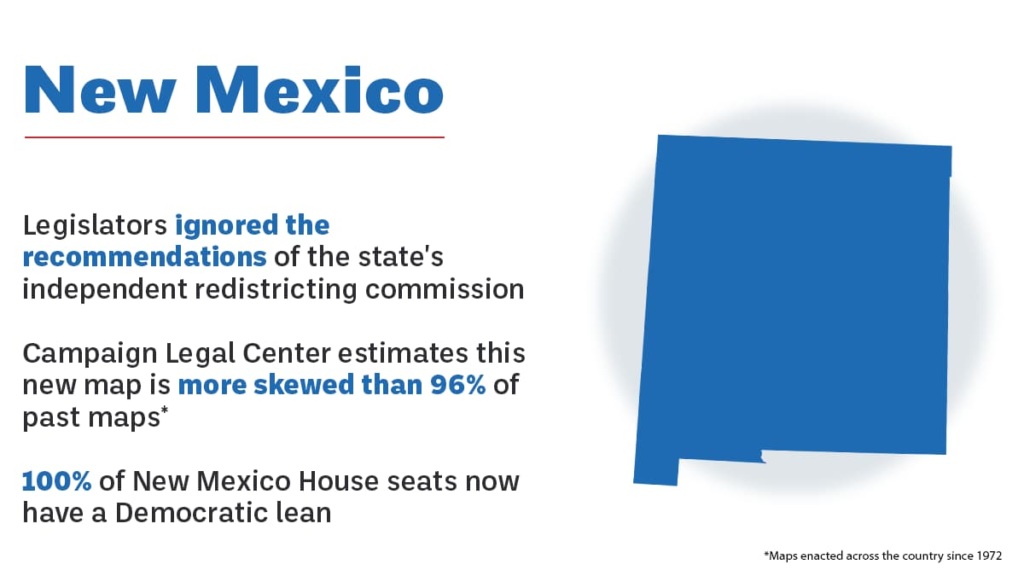
In 2020, Joe Biden carried New Mexico by 10.8 percentage points — winning 54.3% of the vote compared to then-President Donald Trump’s 43.5%. Yet experts predict that Democrats could control 100% of the state’s seats in the U.S. House of Representatives under the new map passed in the state legislature by New Mexico Democrats without any support from New Mexico Republicans.
A newly created seven-member, independent advisory redistricting commission spent three months in 2021 gathering input and feedback from New Mexicans to come up with multiple proposals for new maps, but the Democratic-controlled state legislature was not required to implement any of the group’s proposals.
Democrats currently hold a 2-1 advantage in the state’s congressional delegation. New Mexico Democrats aggressively targeted the district of incumbent Rep. Yvette Herrell (R-NM) and changed it from one that voted for Trump in 2020 by 12 percentage points to one that supported Biden by 6 percentage points.
All three of New Mexico’s congressional districts now have a Democratic lean. The new map lines are drawn to spread out Republican votes just enough for Democrats to win narrowly in each district.
The nonpartisan Campaign Legal Center estimates this new map is more skewed than 96% of the enacted redistricting plans it has analyzed over the past 50 years.
![]()
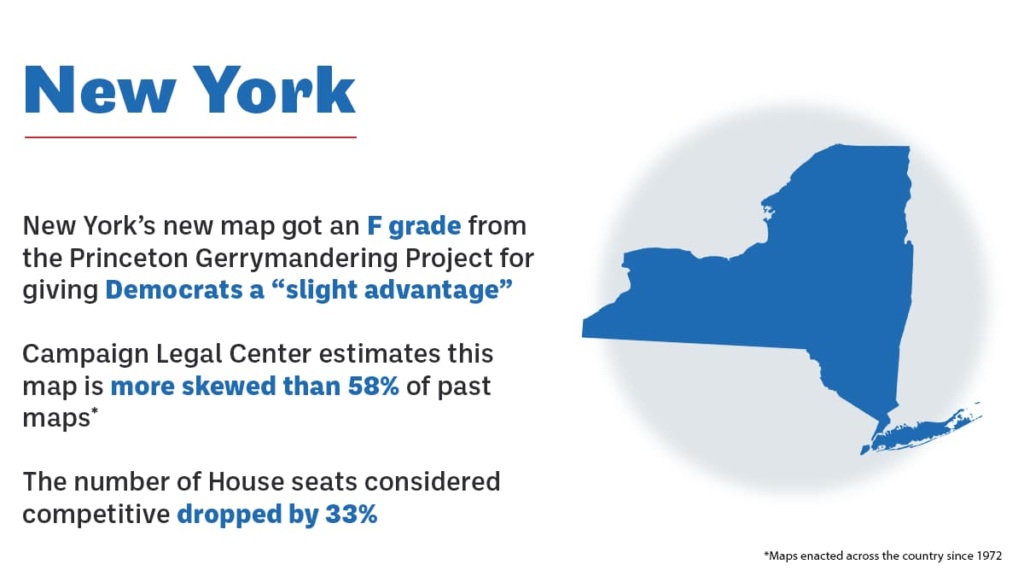
In 2020, Joe Biden carried New York by 23.2 percentage points — winning 60.9% of the vote compared to then-President Donald Trump’s 37.7%. Yet experts predict Democrats will likely control 85% of the state’s seats in the U.S. House of Representatives under the new map passed in the state legislature by New York Democrats without any support from New York Republicans.
While New York lost one seat after the 2020 Census reapportionment, the new map is likely to yield a 22-4 split between Democrats and Republicans, up from Democrats’ current 19-8 advantage. The new map also reduces the number of “highly competitive seats” from 3 to 2.
A 10-member independent redistricting commission — created by voters through a ballot measure in 2014 — failed to reach an agreement last year about new congressional district boundaries, and the Democratic-controlled state legislature was not required to implement any of the commission’s proposals.
The nonpartisan Princeton Gerrymandering Project gave New York’s new map an “F” grade for geographic features and competitiveness, noting the map contains more county splits and “non-compact districts” than what is typical and is also “very uncompetitive relative to other maps that could have been drawn.” The Princeton Gerrymandering Project also said the new map advantages both incumbents and Democrats.
For its part, the nonpartisan Campaign Legal Center estimates the new map is more skewed than 58% of the enacted redistricting plans it has analyzed over the past 50 years.
![]()
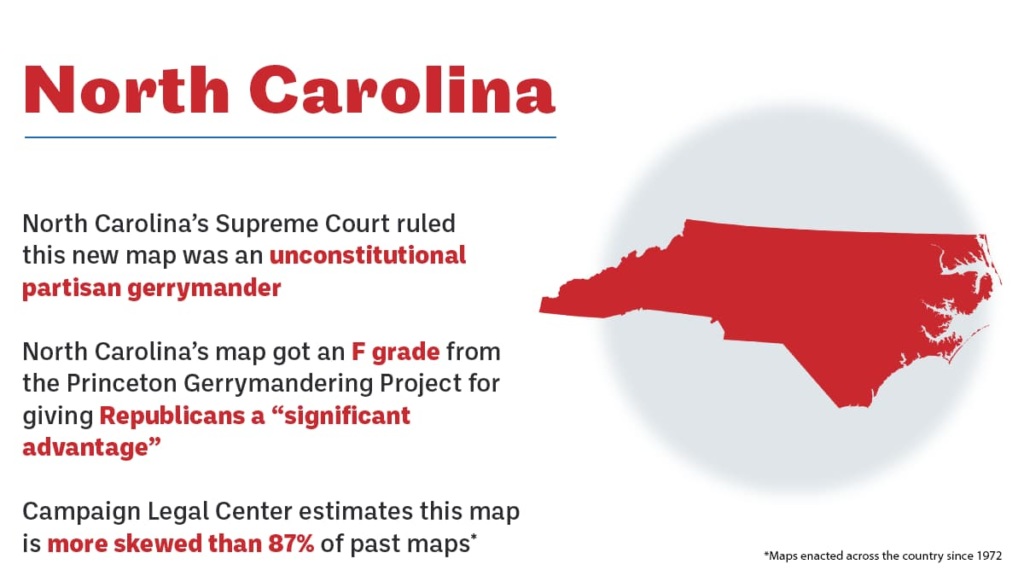
In 2020, then-President Donald Trump carried North Carolina by 1.3 percentage points — winning 49.9% of the vote compared to Joe Biden’s 48.6%. Yet experts predict that Republicans would have likely controlled 71%-79% of the state’s seats in the U.S. House of Representatives under the new map passed in the state legislature by North Carolina Republicans without any support from North Carolina Democrats.
That map — which was recently struck down as unconstitutional by the North Carolina Supreme Court — was expected to yield an 11-3 or 10-4 split between Republicans and Democrats, up from Republicans’ current 8-5 advantage.
Multiple groups had challenged this map, arguing it diluted the voting power of Black voters. Although people of color account for nearly 40% of the population of North Carolina, that map was expected to result in white Republicans representing an overwhelming majority of House seats.
“Achieving partisan advantage incommensurate with a political party’s level of statewide voter support is neither a compelling nor a legitimate governmental interest,” wrote the majority of North Carolina Supreme Court justices. “The General Assembly must not diminish or dilute any individual’s vote on the basis of partisan affiliation.”
The nonpartisan Princeton Gerrymandering Project had given North Carolina’s Republican-drawn map an “F” grade for partisan fairness because it facilitated a “significant Republican advantage.” And the nonpartisan Campaign Legal Center had estimated that this map was more skewed than 87% of the enacted redistricting plans it has analyzed over the past 50 years.
![]()
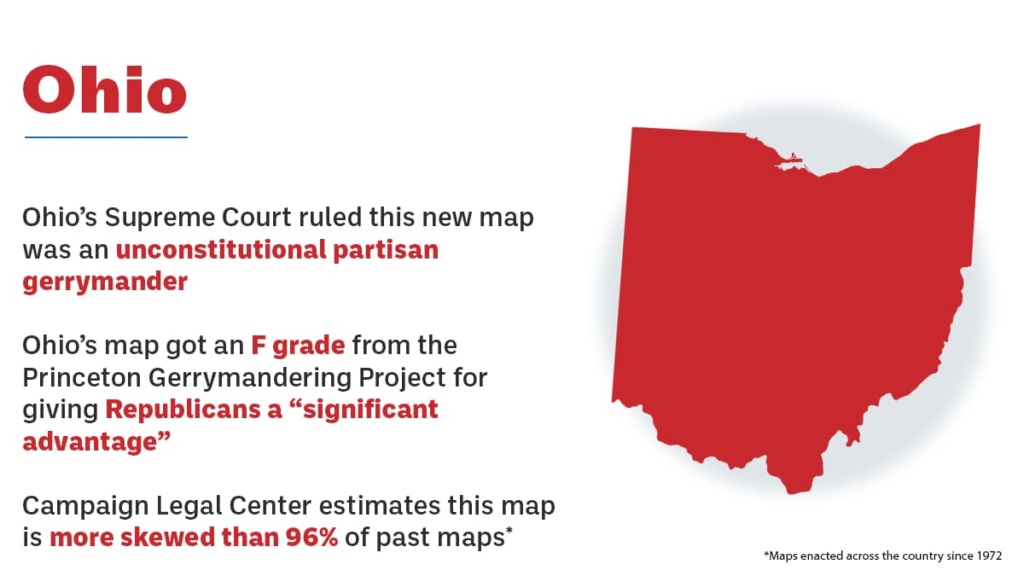
In 2020, then-President Donald Trump carried Ohio by 8.1 percentage points — winning 53.3% of the vote compared to Joe Biden’s 45.2%. Yet experts predicted that Republicans would have likely controlled 87% of the state’s seats in the U.S. House of Representatives under the new map passed in the state legislature by Ohio Republicans without any support from Ohio Democrats.
While Ohio lost one seat after the 2020 Census reapportionment, this map was expected to yield a 13-2 split between Republicans and Democrats, up from Republicans’ current 12-4 advantage.
However, it was challenged in court by groups that argued the map violated the state’s constitution, which prohibits the state legislature from enacting a redistricting plan that “unduly favors or disfavors a political party or its incumbents.” In January, Ohio’s Supreme Court agreed and threw out the new map, with one judge writing, “When the dealer stacks the deck in advance, the house usually wins… That skewed result just does not add up.”
The nonpartisan Princeton Gerrymandering Project had given Ohio’s Republican-drawn map an “F” grade for partisan fairness because it facilitated a “significant Republican advantage.” And the nonpartisan Campaign Legal Center estimated that this map was more skewed than 96% of the enacted redistricting plans it has analyzed over the past 50 years.
![]()
In 2020, Joe Biden carried Oregon by 16.2 percentage points — winning 56.9% of the vote compared to then-President Donald Trump’s 40.7%. Yet experts predict that Democrats will likely control 67%-83% of the state’s seats in the U.S. House of Representatives under the new map passed in the state legislature by Oregon Democrats without any support from Oregon Republicans, who at one point boycotted a floor session to pressure Democrats into drawing a fairer map after Democrats had cut off redistricting negotiations with Republicans.
The new map is likely to yield a 5-1 or 4-2 split between Democrats and Republicans, up from Democrats’ current 4-1 advantage. While Oregon gained one seat after the 2020 Census reapportionment, the new map reduces the number of “highly competitive seats” from 2 to 1.
The nonpartisan Princeton Gerrymandering Project gave Oregon’s new map an “F” grade for partisan fairness because it facilitates a “significant advantage” for Democrats as well as to incumbents. The Princeton Gerrymandering Project also gave Oregon’s new map an “F” grade for competitiveness, noting the map is “very uncompetitive relative to other maps that could have been drawn.” Meanwhile, the nonpartisan Campaign Legal Center estimated that Oregon’s new map is more skewed than 74% of the enacted redistricting plans it has analyzed over the past 50 years.
![]()
In 2020, then-President Donald Trump carried Texas by 5.6 percentage points — winning 52.1% of the vote compared to Joe Biden’s 46.5%. Yet experts predict that Republicans will likely control 63%-66% of the state’s seats in the U.S. House of Representatives under the new map passed in the state legislature by Texas Republicans with support from just one Texas Democrat.
The new map is likely to yield either a 24-14 or 25-13 split between Republicans and Democrats, up from Republicans’ current 23-13 advantage. The map also reduces the number of “highly competitive seats” from 6 to 1.
The nonpartisan Princeton Gerrymandering Project gave Texas’ new map an “F” grade for partisan fairness because it facilitates a “significant Republican advantage” as well as an “F” grade for geographic features because it contains more county splits and “non-compact districts” than what is typical. And the nonpartisan Campaign Legal Center estimates that the new map is more skewed than 78% of the enacted redistricting plans it has analyzed over the past 50 years.
Observers have argued Texas’s new map does not fairly reflect the demographics of the state’s residents. While white people make up only 40% of Texas’ population, they will likely represent 60% of the state’s House districts. Hispanic advocacy organizations have filed two lawsuits to contest the new map, and the U.S. Department of Justice has likewise challenged the new map, arguing it violates the Voting Rights Act by diluting the voting power of African American and Latino voters in Texas.
![]()
In 2020, then-President Donald Trump carried Utah by 20.5 percentage points — winning 58.2% of the vote compared to Joe Biden’s 37.7%. Yet experts predict that Republicans will likely control 100% of the state’s seats in the U.S. House of Representatives under the new map passed in the state legislature by Utah Republicans without any support from Utah Democrats.
The new map goes against the recommendations of Utah’s independent redistricting commission, which was created after voters passed a ballot measure in 2018. The commission proposed three maps that would have created three Republican-leaning seats and one Democratic-leaning seat in the state. However, the Republican-controlled state legislature bypassed the independent redistricting commission and drew its own map. The nonpartisan Campaign Legal Center estimates this new map is more skewed than 99% of the enacted redistricting plans it has analyzed over the past 50 years.
The new map is likely to yield a 4-0 split between Republicans and Democrats. While Republicans currently represent all four of Utah’s House seats, one of the districts has been twice represented by a Democrat during the past decade. That seat became far less competitive under the new map, which splits Democrats who live in the Salt Lake City metro area between all four congressional districts, a tactic known as “cracking,” which reduces the influence of a constituency or community of voters.
![]()
In 2020, Joe Biden narrowly carried Wisconsin by 0.7 percentage points — winning 49.6% of the vote compared to then-President Donald Trump’s 48.9%. Yet experts predicted that Republicans would have likely controlled 75% of the state’s seats in the U.S. House of Representatives under the new map passed last year in the state legislature by Wisconsin Republicans without any support from Wisconsin Democrats.
That map, which was vetoed in December by Democratic Gov. Tony Evers, was expected to yield a 6-2 split between Republicans and Democrats, up from the Republicans’ current 5-3 advantage. Because of the governor’s veto, the responsibility for drawing a new map now falls to the Wisconsin Supreme Court, where conservatives hold a 4-3 majority.
The nonpartisan Princeton Gerrymandering Project gave Wisconsin’s new map an “F” grade for partisan fairness because it facilitated “significant advantages” to Republicans as well as to incumbents. The Princeton Gerrymandering Project also gave this map an “F” grade for competitiveness, noting the map was “very uncompetitive relative to other maps that could have been drawn.”
For its part, the nonpartisan Campaign Legal Center estimated that this map was more skewed than 97% of the enacted redistricting plans it has analyzed over the past 50 years.
In 2020, Evers established a “People’s Maps Commission” — composed of nine Wisconsinites selected by retired judges — to independently draw new maps. The commission proposed a new congressional map that earned an “A” grade for partisan fairness from the Princeton Gerrymandering Project, but it was rejected by the Republican-controlled state legislature.
![]()
Amisa Ratliff contributed to this report.
Issue: Gerrymandering

Reports
Included below is an executive summary of Laboratories of Capture: How the Tech Lobby Shapes State Data Privacy Laws. To read the full report, click the link below.

Reports
Understanding and mitigating election official turnover to build election workforce resiliency...
Introduction In the five years since the monumental 2020 presidential election cast an intense spotlight on election administration processes, the public servants from across the ideological spectrum who run our…

Reports
How the Politicization of Cyber Is Crippling U.S. National Security...
Executive Summary For decades, presidents and Congress treated cybersecurity as a bipartisan imperative. Republican and Democratic administrations alike recognized that defending America’s digital infrastructure is as essential as safeguarding our…